WalletHub says Frisco, Texas is the best real estate market in the United States for 2026. It scored 300 cities and put Frisco at the top of the list with a total score of 70.72 out of 100. Three more North Texas cities landed in the national top 10 alongside it.
Our own sold data says something different about what it costs to sell a house in Frisco right now. Over the trailing 12 months, 82.1 percent of Frisco closings finished below the home's original asking price. As of our August 27, 2026 pull, 59.7 percent of active Frisco listings were carrying a price cut. And in this issue's metro-wide over-ask study, covering the 90 days ending August 27, 2026, zero Frisco subdivisions qualified for a list of 25.
The ranking is not wrong. It is measuring something else. WalletHub is scoring a city: its housing stock, its job growth, its home prices relative to income. Those are real strengths and Frisco has them. None of them prices a house.
Here is what the ranking measures, the ambiguity on WalletHub's own page, and what our NTREIS warehouse says about the market underneath the trophy.
Key Takeaways
- Zero Frisco subdivisions made this issue's over-ask list. Our metro-wide study of closed sales in the 90 days ending August 27, 2026 ranked 25 DFW subdivisions that genuinely sold over their original asking price once seller concessions came out. None of them is in Frisco.
- Fort Worth alone accounts for nine of those subdivisions. The over-ask map in this market is a Tarrant County map, not a trophy suburb map.
- Frisco is second, not first, on WalletHub's own Real Estate Market sub index. Durham, North Carolina is first there. What pushes Frisco past Durham overall is the smaller affordability and economic dimension.
- Most Frisco closings finish below the original ask. Our warehouse puts that share at 82.1 percent over the trailing 12 months.
- The ranking contains no metric for closed sale prices, seller concessions, price cuts, list to sale ratios, or months of supply. It was never built to price a house.
The Trophy, Explained
WalletHub built its 2026 Best Real Estate Markets study on 300 U.S. cities, 17 metrics, and two dimensions. Real Estate Market carries 80 of the 100 total points across 10 metrics. Affordability and Economic Environment carries the remaining 20 across 7 metrics, with Housing Affordability at double weight inside that smaller share. The underlying data was pulled as of July 22, 2026 from the Census Bureau, the Bureau of Labor Statistics, Zillow, TransUnion, the National Association of Realtors, and ATTOM, among others.
That structure matters more than the headline number. A city can win this ranking by having the best housing market in the country, or by pairing a strong but not best housing market with the best affordability and economic profile. Frisco won the second way.
The Page and the Table Use the Same Words Differently
Start with WalletHub's own scoring table, pulled directly from the data behind the published study.
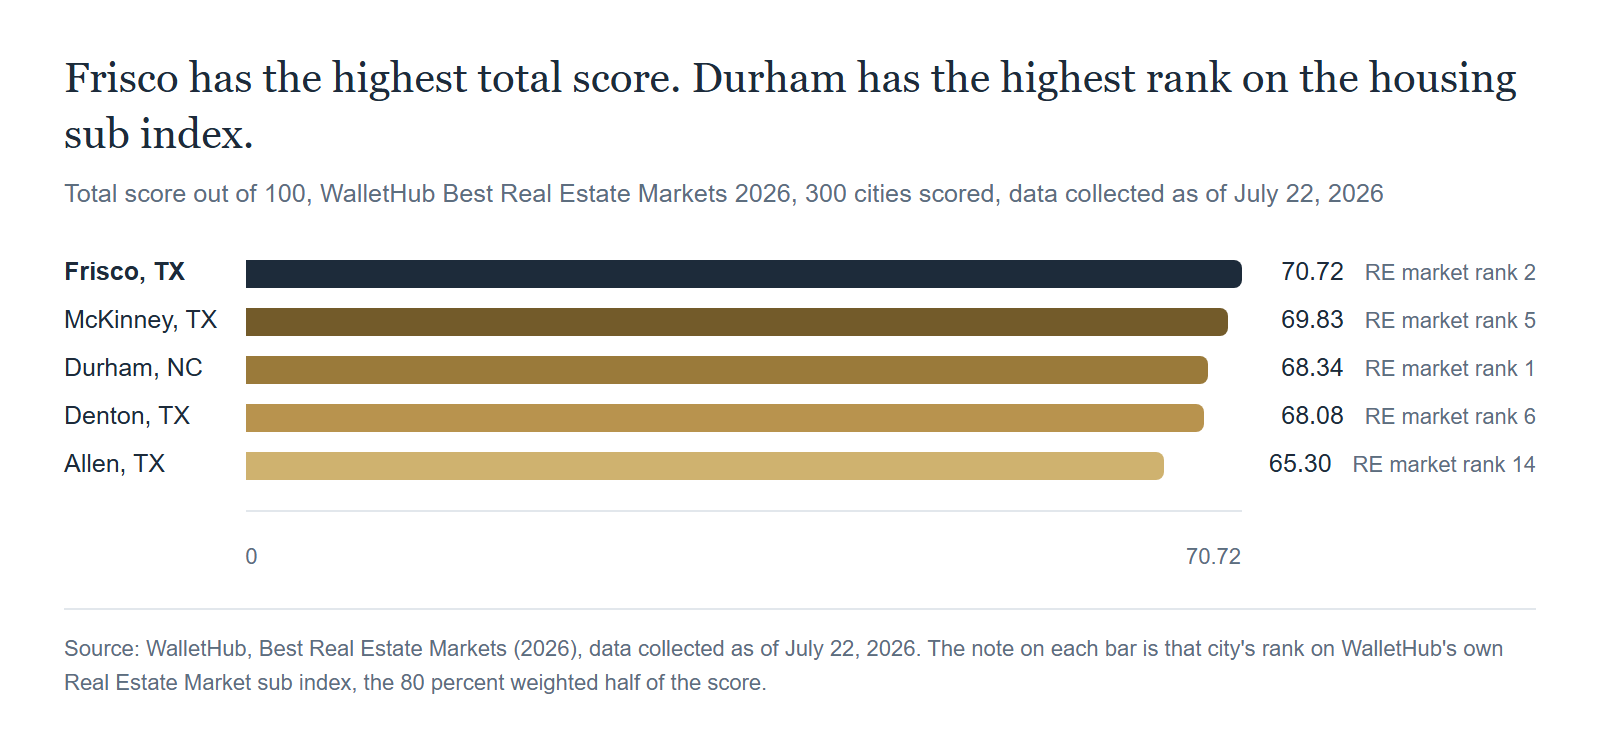
Durham, North Carolina holds the number 1 Real Estate Market sub rank in the country. That is the sub index tied most directly to the health of the housing market itself: appreciation, days on market, foreclosure rate, vacancy rate. Frisco sits second there. But Durham's Affordability and Economic Environment sub rank is 39th, and that 20 percent weighted dimension is enough to drop Durham to fourth overall while lifting Frisco, first on affordability, to the top, even though Durham beats it on the dimension carrying four fifths of the weight.
Full list, for reference:
Overall Rank | City | Total Score | Real Estate Market Rank | Affordability & Economic Env. Rank |
|---|---|---|---|---|
1 | Frisco, TX | 70.72 | 2 | 1 |
2 | McKinney, TX | 69.83 | 5 | 3 |
4 | Durham, NC | 68.34 | 1 | 39 |
5 | Denton, TX | 68.08 | 6 | 22 |
8 | Allen, TX | 65.30 | 14 | 11 |
Then read WalletHub's own written commentary on the same page. It says: "Frisco, TX, has the best real estate market, with the highest share of houses that were built between 2010 and 2024, at nearly 47%." A few lines later: "McKinney, TX, has the second-best real estate market in the U.S." Read as descriptions of the overall ranking, both sentences are right. Read as descriptions of the sub index the study itself names Real Estate Market, neither is: that table puts Durham first, Frisco second, and McKinney fifth. WalletHub does not resolve which it means on the page we read, and that is the whole problem with reading "best real estate market" as a statement about the housing market.
There is a history correction worth making here too. McKinney is reported by multiple named outlets to have held WalletHub's number 1 overall spot in 2025 with a score of 72.33, and CultureMap Dallas described that as three years running at the top, which would mean 2023 through 2025. The same outlet puts Frisco sixth in the 2025 study before its jump to first. WalletHub overwrites its study URL each year rather than keeping past versions live, so we cannot check any of that against the source. It is reported, with CultureMap Dallas named, and not verified.
A Zillow Guess, Applied to a Nondisclosure State
Texas is what the Texas Real Estate Research Center calls a nondisclosure state. In our own practice, every comp we run comes out of NTREIS, not a courthouse filing.
That runs straight into the first of the 10 metrics in WalletHub's Real Estate Market dimension: Home Value Forecast, based on Zillow's model predicting the Zillow Home Value Index one year forward from the study's collection date. It carries full weight, about 8 points, the same as each of the other nine metrics in that dimension and more than any single affordability metric, which makes it tied for the heaviest input in the whole ranking. It is not a measurement of what already happened. It is a model's guess about what happens next, applied to a state TRERC calls a nondisclosure state.
The rest of the gap is worth naming plainly. None of WalletHub's 17 metrics measures an actual sale price. The price related ones are an appreciation rate, that Zillow forecast, a rent to sale price ratio, and a price to income ratio. There is no metric for seller concessions or buyer incentives, no list to sale price ratio, and no price cut frequency. There is no months of supply or active inventory metric either; the closest proxies are Vacancy Rate and Building Permit Activity, which describe housing stock and construction pace, not how many homes are sitting unsold. And every score is a citywide average, so a large, fast growing suburb like Frisco gets one number no matter how its submarkets differ.
None of that makes the ranking dishonest. It makes it a different instrument than most readers assume. Paragon's own NTREIS warehouse holds the closings for exactly this market, so we ran the measures the ranking does not carry.
What Our Own Closings Show
Two of WalletHub's own Real Estate Market metrics, median home price appreciation and median days on the market, measure things Paragon's warehouse also measures. So we ran them, as of our own August 27, 2026 pull. WalletHub's data is as of July 22, 2026 and ours are NTREIS closings over the periods noted, so read what follows as a parallel measurement, not a replication.
Frisco's median days on market over the trailing 12 months is 36, three days faster than McKinney's 39. Frisco's Q2 2026 median closed price fell 3.1 percent year over year, while McKinney's rose 0.2 percent on the same comparison. Both are quarterly medians and both move with whatever mix of homes closed, so the steadier readings are the share measures below.
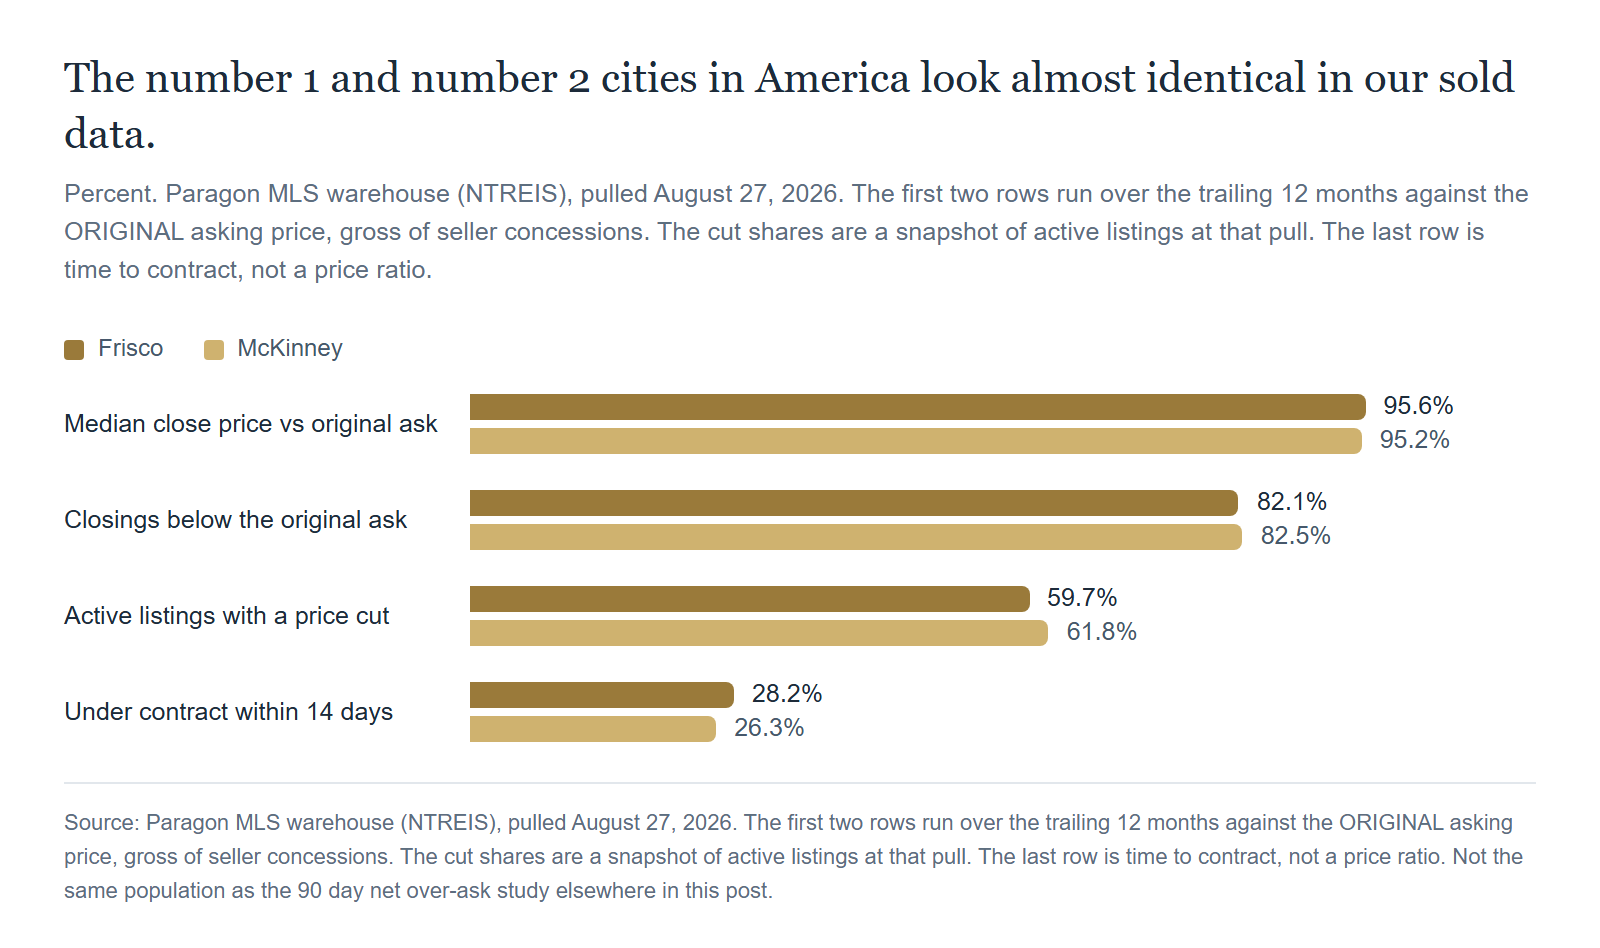
The story in that chart is not that Frisco is weak. It is that the country's number 1 and number 2 ranked housing markets are, in the sold data, nearly identical on these four measures. Both sell the typical home for about 95 percent of what it first asked. In both, better than eight closings in ten finish below that first ask, and roughly six active listings in ten already carry a cut. Whatever separates them on a national scorecard does not show up in how a house trades in either one.
Full list, for reference:
Metric (trailing period noted) | Frisco | McKinney |
|---|---|---|
Median days on market (trailing 12mo) | 36 | 39.0 |
Q2 2026 median price, year over year | -3.1% | +0.2% |
Median close price vs original ask (trailing 12mo) | 95.6% | 95.2% |
Active listings with a price cut | 59.7% | 61.8% |
Closings below original asking price (trailing 12mo) | 82.1% | 82.5% |
Under contract within 14 days (trailing 12mo) | 28.2% | 26.3% |
Months of supply (trailing 90d) | 4.46 | 3.94 |
Based on information from the North Texas Real Estate Information Systems, Inc. Period per stat below. Data deemed reliable, but is not guaranteed accurate by the MLS or NTREIS.
Supply is the one measure that argues the other way, and it deserves its own scale.
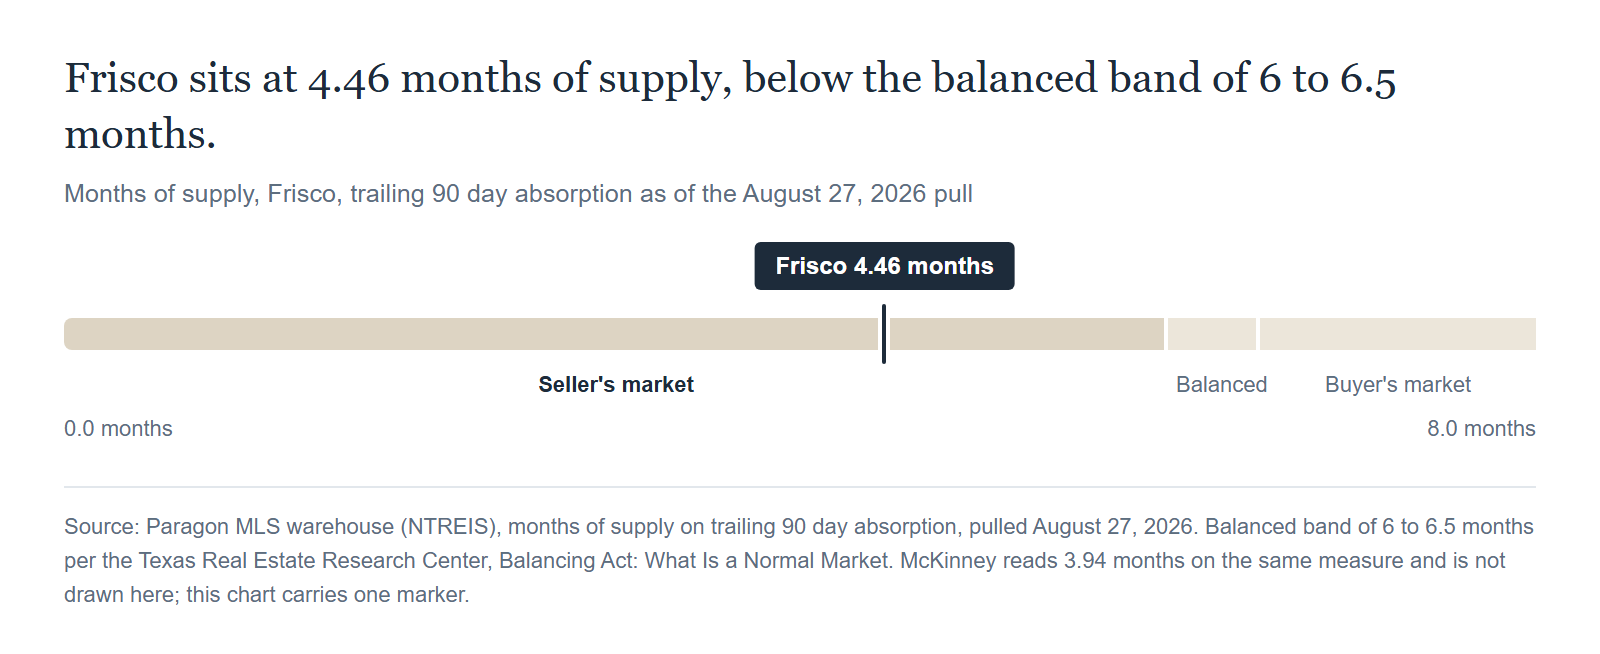
The Texas Real Estate Research Center puts a balanced market at six to six and a half months. Frisco reads 4.46 months and McKinney 3.94 on the same measure. Neither city is oversupplied by that standard, and that is the honest counterweight to everything above.
Price cuts also have geography, and a citywide average hides it. Here is that measure across Frisco, McKinney, and the neighborhoods between them, drawn on our own market map.
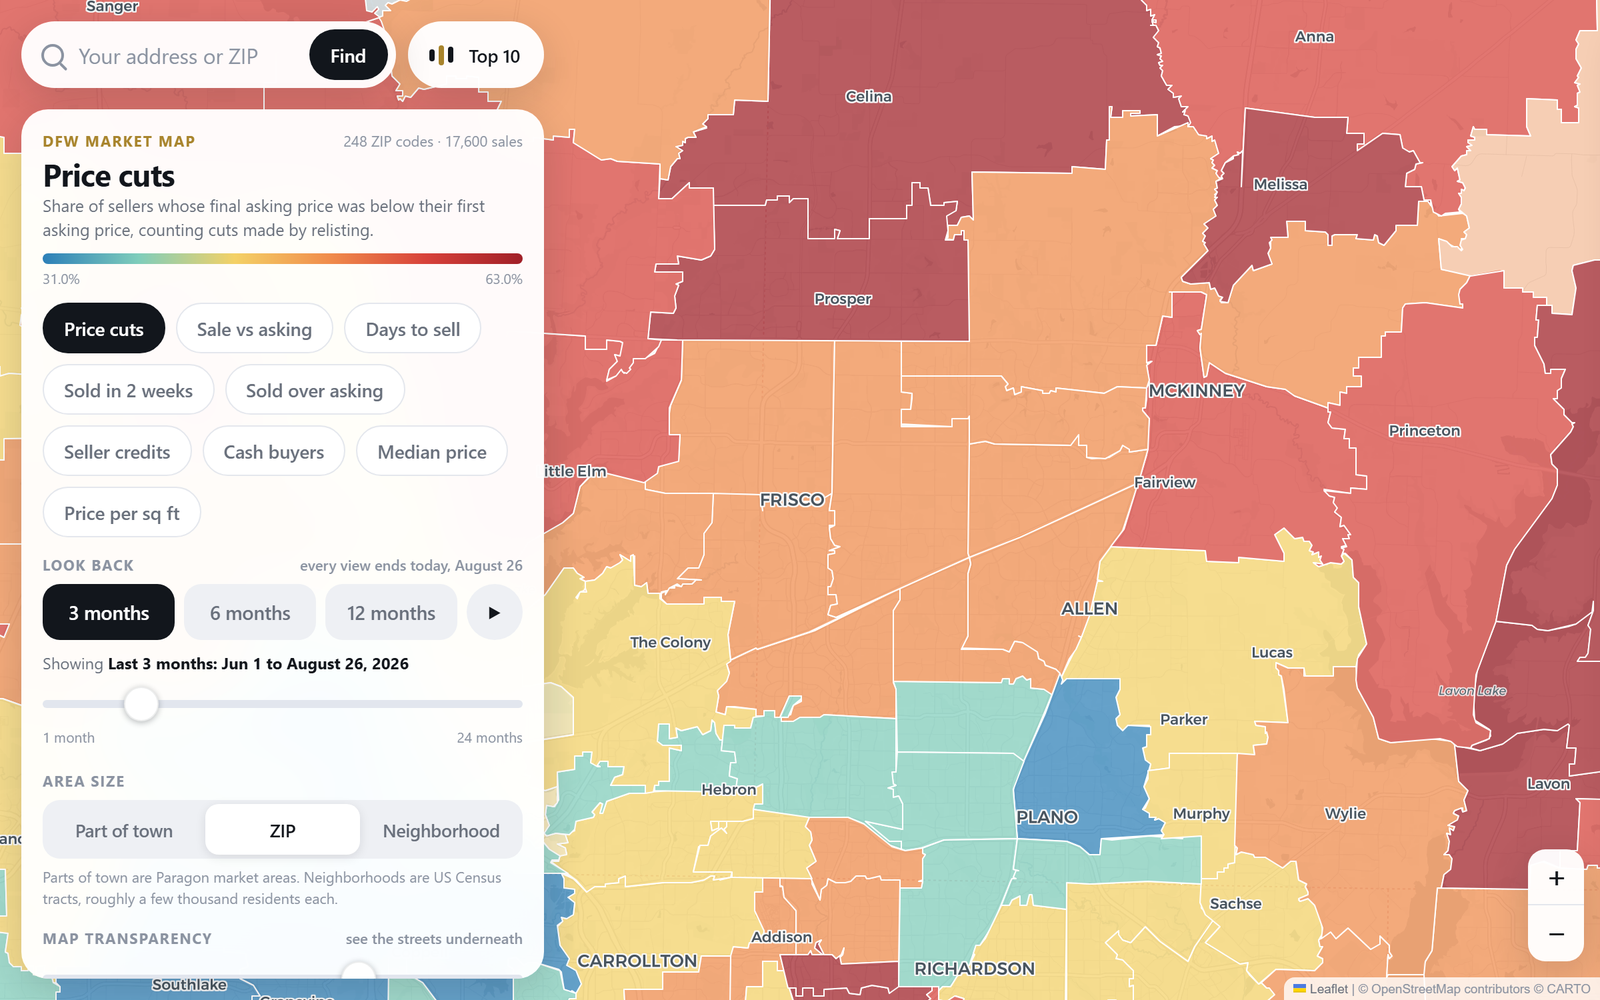
Price cuts across Frisco and McKinney on the Paragon DFW market map. The map defines this layer as the share of sellers whose final asking price was below their first asking price, counting cuts made by relisting. Source: Paragon DFW market map (NTREIS).
The map is live at homes.paragondfw.com/market-map. Set the metric to price cuts, zoom to your own street, and read the number for your neighborhood instead of the one for your city.
None of this is a claim that the ranking is fraudulent or that Frisco is a bad place to own a home. It is an audit, not a complaint: we ran our own measure of the concepts the ranking also scores, and one of them points the other way from what a number 1 headline implies.
Zero for Frisco: What Our Own Over-Ask Table Says
This issue of Paragon Perspective also ran a metro-wide study of every closed residential sale reported to NTREIS in the nine core DFW counties in the 90 days ending August 27, 2026, above $50,000 and in a named subdivision, testing which subdivisions genuinely sold over their original asking price once seller concessions are netted out. Sales with an unconfirmed concession figure come out of both sides. That study read 23,857 closed sales, and its result for Frisco is local evidence against the trophy headline.
Across the full study, 25 DFW subdivisions cleared both floors required to be ranked at all: at least six sales with a known concession figure, and at least three net over ask wins. Frisco produced zero.
That number does not mean no Frisco home sold over asking; individual Frisco homes did. Across the metro, 478 subdivisions cleared the sales floor before the win floor was applied, but that is a metro wide count and Frisco's own number on the ranked list is zero. What it means is narrower: no Frisco subdivision produced three genuine net over ask sales in the window, which subdivisions in Watauga, Haltom City, Garland, and Fort Worth did.
McKinney, WalletHub's number 2 finisher, did marginally better: exactly one qualifying subdivision, Trinity Falls, at 8.3 percent, which is 4 net wins out of 48 known concession sales at a median net premium of 0.5 percent. That is one of the lower net rates in the full table of 25.
Of the 25 qualifying subdivisions, 14 are in Tarrant County, 7 in Dallas County, 3 in Denton County, and 1 in Collin County. Fort Worth holds eight of Tarrant's fourteen; its ninth entry, Lonestar at Liberty Trails, is in Denton County. The two cities WalletHub just ranked first and second in the country for real estate produced one qualifying over ask subdivision between them, and it is McKinney's.
Metro wide, the study puts the honest over ask rate at 6.7 percent of sales with a known concession figure, against 10.7 percent before concessions come out. The over ask map in this market is a Tarrant County map, and a ranking built on economic and affordability metrics has no way to see that from the outside.
The Streak That Actually Ended
None of this erases what is genuinely strong about Frisco or McKinney. WalletHub credits Frisco with nearly 47 percent of its housing stock built between 2010 and 2024, the highest share of any city studied, and the seventh best job growth rate in the country. It credits McKinney with roughly 40 percent of its housing built in that window, the second highest share studied, the 10th highest building permits per capita, and the sixth best job growth rate. Those are real, verifiable strengths.
But the streak framing deserves one more honest look. CultureMap reported McKinney's 2025 winning score as 72.33, higher than Frisco's 70.72 in 2026. That hints at a story where the whole field cooled, not only one where Frisco overtook McKinney. We name it as a possibility, not a fact: the 2025 methodology page is no longer live, so we cannot confirm the two years used an identical metric set and weighting.
The Honest Counterargument: A Normal Market, Not a Distressed One
Our own audit deserves the same honesty we ask of WalletHub's ranking. None of the figures above describe a distressed market. The supply chart is the cleanest version of that argument: at 4.46 months, Frisco runs tighter than the balanced band even carrying its current cut share. Most active Frisco listings carry a cut; the typical Frisco closing over the trailing 12 months still cleared in about five weeks. Two different populations, and in our read they show a slow start rather than a break.
A single quarter's median price swing deserves caution on its own terms too. This issue's Grapevine companion piece shows a 16.2 percent jump on the same quarterly comparison, a figure our own MLS card flags as mix sensitive on small samples, which is why that piece pairs it with the steadier price per square foot reading. Frisco's quarterly sample is far larger, but the caution about reading one quarter's median as destiny cuts both ways.
That case is worth making honestly, and it does not change the rest of the picture. The active cut share is a snapshot of what is on the market. The share of closings finishing below original ask runs over a full trailing 12 months. The zero qualifying subdivisions come out of a 90 day study window. None of the three is a single quarter's median, and they tell the same story independent of any one quarter's noise. WalletHub's badge measures what its 17 metrics measure, and Frisco earned it. It is not a read on how a specific Frisco listing will negotiate this quarter, and both things are true at once.
The Paragon Angle
A WalletHub number 1 is a citywide score built from metrics collected as of July 22, 2026, one of them a forecast of the year ahead. It is not a green light to price a listing above what the sold comps in that neighborhood actually support, and right now our own numbers say Frisco buyers have more room to negotiate than the headline suggests.
Here is what that room looks like concretely. A Frisco listing that goes on the market this week steps into 4.46 months of unsold supply and a board where the median active price cut is already $30,000, or 4.2 percent of list. In our experience, the listing that sits long enough to become part of next quarter's cut share statistic is the one priced off a headline instead of off that data.
Buyers should read the ranking the opposite way. A national badge is not a signal to rush or waive contingencies. It says the city scores well on economic and demographic strength, while the sold data says a buyer has more near term negotiating room than the badge implies. Either way, the sold data on your specific street, not the national trophy, is what should set the number.
Frequently Asked Questions
Is Frisco really the best place to buy a house in 2026?
WalletHub ranked it number 1 overall for 2026, on a methodology that is 80 percent housing market metrics and 20 percent affordability and economic ones, and its finish in that smaller dimension is what pushed it past Durham. No part of the study reads current local closed sales, price cuts, or list to sale ratios. Our own MLS data shows a market where most active listings carry a price cut and most recent closings finished below the original ask, which gives a buyer real negotiating room right now, not a reason to avoid the city long term.
What does WalletHub's number 1 real estate market ranking actually measure?
It combines 17 metrics across two dimensions: an 80 percent weighted Real Estate Market dimension (appreciation forecast, days on market, foreclosure and delinquency rates, vacancy, new housing share, permit activity) and a 20 percent weighted Affordability and Economic Environment dimension (housing and maintenance costs relative to income, population and job growth, unemployment, credit scores). Frisco's overall finish is driven more by the smaller affordability dimension than by having the single best housing market fundamentals in the country.
Why is Frisco's median closed price down if it is ranked number 1 in the country?
The ranking measures broad city health, and its heaviest individual input, tied with nine others at about 8 points, is a one year Zillow price forecast rather than a read on local sale prices. Our warehouse shows Frisco's Q2 2026 median closed price down 3.1 percent year over year, alongside a 59.7 percent active cut share. Both can be true at once because they measure different things.
Is Frisco or McKinney the better place to buy right now?
WalletHub's own write ups credit young housing stock and strong job growth in each. Both also show real negotiating room for buyers in our data, and the two cities are within three points of each other on every share measure we ran. Frisco produced zero qualifying over ask subdivisions against McKinney's one, Trinity Falls. Neither city's sold data currently favors an aggressive seller's approach. The honest answer depends on the specific street and subdivision, not on which city holds the national trophy this year.
Does a high WalletHub ranking mean home values are rising right now?
Not necessarily. Affordability and job growth metrics can stay strong even while near term sale prices soften, which is close to what our MLS data shows in Frisco today. A national ranking is a snapshot of broad city health, built here on data collected as of July 22, 2026. Local sold data, refreshed as closings are reported to NTREIS, is the more current read.
Conclusion: The Trophy Measures the City. The Sold Data Prices Your House.
Frisco earned its finish honestly, on real strengths: a young housing stock, strong job growth, and a favorable affordability profile relative to income. That is a genuine achievement, and it is a measurement of the city, not of what any specific home is worth this quarter.
Price a home, or set an offer, off the sold data on that block, not off a national methodology built to rank 300 cities on a single scale. The trophy and the transaction are answering two different questions.
Talk to Paragon
Curious what the local numbers say about your Frisco home, or any DFW property? We spend our time in the sold data, not the national rankings, and we are glad to walk through what it means for a specific listing or offer.
Reach us at [email protected] or call (469) 290-7593. More at paragondfw.com/contact.
Related Articles
- The Appraisal Escalator: Dallas Is About to Cut Your Tax Rate for an 11th Year
- We Fact-Checked Every Over-Asking Sale in DFW. Concessions Knock Nearly 4 in 10 Back to Asking or Below.
- Grapevine: The Small Town DFW Grew Around and Never Flattened
- America's Fastest-Growing City Is Getting Cheaper
- A Theme Park Just Opened in Frisco. What Does It Do to Home Values?
Sources
- WalletHub, "Best Real Estate Markets (2026)": https://wallethub.com/edu/best-real-estate-markets/14889
- CultureMap Dallas, "Frisco home to No. 1 real estate market in America in 2026" (August 19-20, 2026)
- CultureMap Dallas, "McKinney has the No. 1 housing market in the U.S. for 2025"
- Hoodline, "North Texas Cities Dominate Top Real Estate Markets, with McKinney and Frisco Leading: WalletHub 2024 Report"
- City of Frisco, Demographics page: https://www.friscotexas.gov/1454/Demographics
- Frisco Economic Development Corporation, demographics page: https://friscoedc.com/data-and-research/demographics
- Paragon MLS warehouse (NTREIS), `scripts/mls_stats.py` (public mode), pulled August 27, 2026
- Paragon over-ask study, `scripts/over_ask_report.py --end-date 2026-08-27 --days 90`, run August 27, 2026 (window: the 90 days ending August 27, 2026)
- Paragon DFW market map, price cut layer: https://homes.paragondfw.com/market-map
- Texas Real Estate Research Center, Balancing Act: What Is a Normal Market? https://trerc.tamu.edu/article/balancing-act-what-is-a-normal-market/
- Texas Real Estate Research Center, "Home Price Index," on Texas as a nondisclosure state: https://trerc.tamu.edu/article/home-price-index/
- National Association of Realtors, Economists' Outlook: Inventory and Months' Supply, https://www.nar.realtor/blogs/economists-outlook/inventory-and-months-supply