Somebody at every DFW cookout this summer has said it: "we sold over asking." It gets repeated at closing tables, listing presentations, and group chats, usually with no definition attached. Over what asking price, the one the seller started with or the one after the third price cut. Before or after the seller wrote a check back to the buyer at closing to make the deal work. Few people ask, and the phrase keeps circulating anyway.
So we checked it. Paragon pulled every closed residential sale reported to the North Texas Real Estate Information Systems (NTREIS) in the 90 days ending August 27, 2026, across the nine core DFW counties, above $50,000 and in a named subdivision, then applied one test to each: did the close price beat the first asking price in the listing's history, not the price after cuts, and did it still beat both that first price and the final list price once we subtracted whatever the seller paid back at closing. Sales where the concession could not be confirmed leave the count in both directions. No cherry-picking neighborhoods.
The honest answer is a lot smaller than the cookout version, and most of the neighborhoods that clear the bar sit in one county.
Key Takeaways
- Nearly four in ten sales that looked like an over-asking win gave the premium back at the closing table. Once seller concessions come out, those sales land at the asking price or below it.
- The honest, metro-wide over-ask rate for DFW right now, net of concessions, is 6.7 percent. The other 93.3 percent of sales did not clear the bar.
- A gross count, before concessions, reports a bigger number on a bigger base. It answers a different question, and it is the version that usually reaches you.
- The real wins are concentrated. Tarrant County holds a majority of the qualifying subdivisions, and Fort Worth alone holds more of them than any other city in the metro.
- No Frisco subdivision cleared the bar at all, in the same summer a national ranking crowned Frisco the number one housing market in America.
The Chain-First Test
The rules come from Paragon's own method document of August 19, 2026, cited in the sources below, and the metro-scale mapping that preceded them is in We Mapped 301,062 DFW Home Sales. Go Find Your Neighborhood (August 11, 2026). The short version, for anyone catching up:
1. Beat the first asking price, not the last one. The close price has to beat the original list price of the first listing in the relist chain, looking back up to 365 days before close. A home that asked $500,000, cut to $460,000, and closed at $465,000 sold under its first ask, after a cut, not over asking.
2. Net the seller concessions. Net equals close price minus seller contributions, and that net still has to beat both the final list price and the first ask from rule one. Concession sales are not thrown out. Some of them still net over, and those count as real wins.
3. Unseen concessions leave the count entirely. In both directions: a sale with no parsed concession figure can never count as a win, and it also comes out of the denominator, so it cannot quietly pad the percentage from either side.
One wording note, because it changes what is true. When a seller's concession is exactly the size of the premium, the net lands precisely on an asking price rather than under it. That happened 129 times in this window, which is why the finding is stated as "asking or below" and never as "below asking." The other 828 landed strictly under.
The filters underneath all three rules: closed residential sales inside the 90-day window, list and close price both above $50,000, the nine core DFW counties (Dallas, Tarrant, Collin, Denton, Rockwall, Ellis, Kaufman, Johnson, and Parker), a non-blank subdivision, and at least 6 known-concession sales plus 3 net wins before a subdivision gets ranked, so one lucky sale in a four-home pocket cannot masquerade as a trend.
The Gross-to-Net Gap
Here is where the cookout version of the story falls apart.
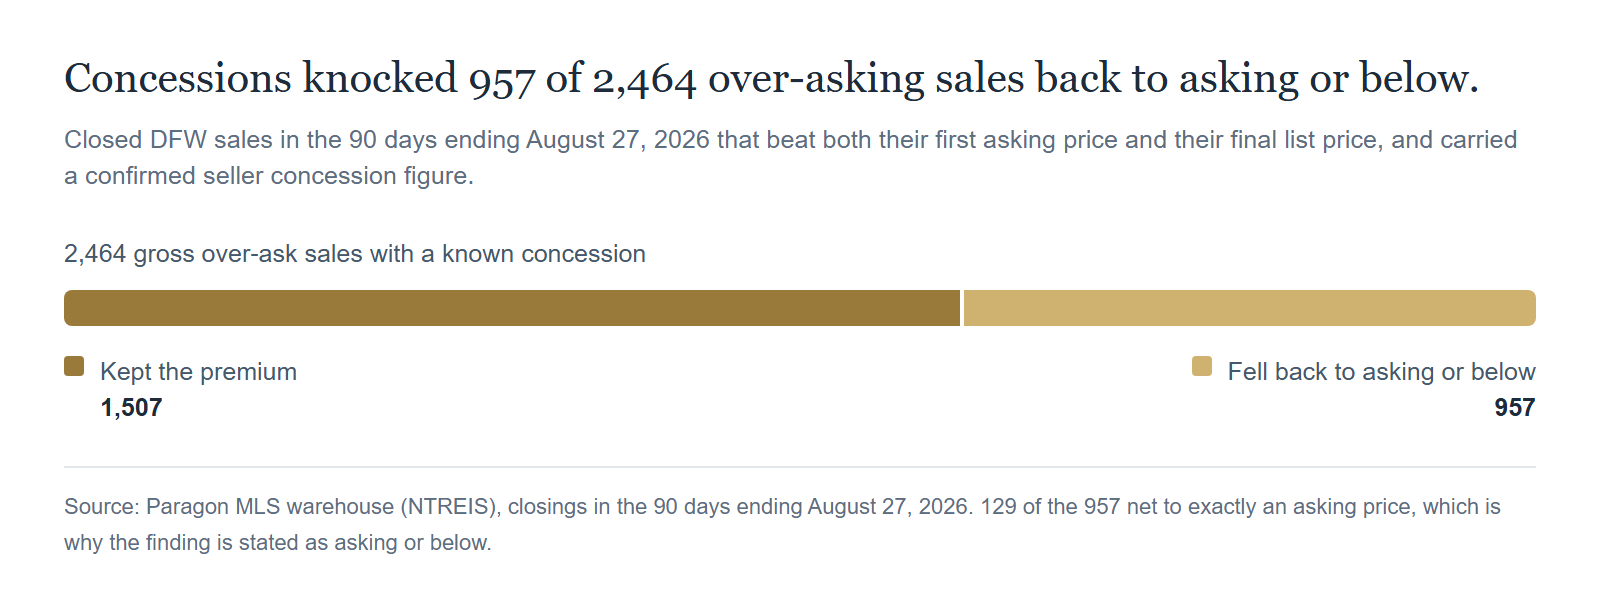
Two thousand four hundred sixty-four sales in the window beat both their chain-first original asking price and their final list price before anything was subtracted, and we could confirm the seller concession figure on every one of them. That is one population on one scale, which is the only way a share like this can be read honestly. Subtract the concessions and 1,507 of them still clear both hurdles. The remaining 957, or 38.8 percent, do not. Nearly four in ten.
That share belongs to those 2,464 sales specifically. It is not a share of every closed sale in DFW, and it is not the same denominator as any other percentage in this piece. Measured the looser way the original method document used, counting gross wins whether or not the concession could be seen, the same shape comes out at 40.8 percent. Both round to about four in ten. The strict figure is the one the gross-to-net chart draws.
This is the difference between a claim a homeowner can verify and one a homeowner can refute with their own settlement statement. Take an illustrative case, invented to show the arithmetic rather than drawn from any actual sale: a seller whose close price beat the first ask by less than $15,000, then wrote a $15,000 credit at closing for repairs or a rate buydown, did not keep that premium. Whether a credit erases the win depends on how big the gross premium was, which is exactly why the test nets each sale rather than disqualifying concessions outright.
The Real Metro Number
So what is the honest, metro-wide rate on the base that counts every eligible sale.
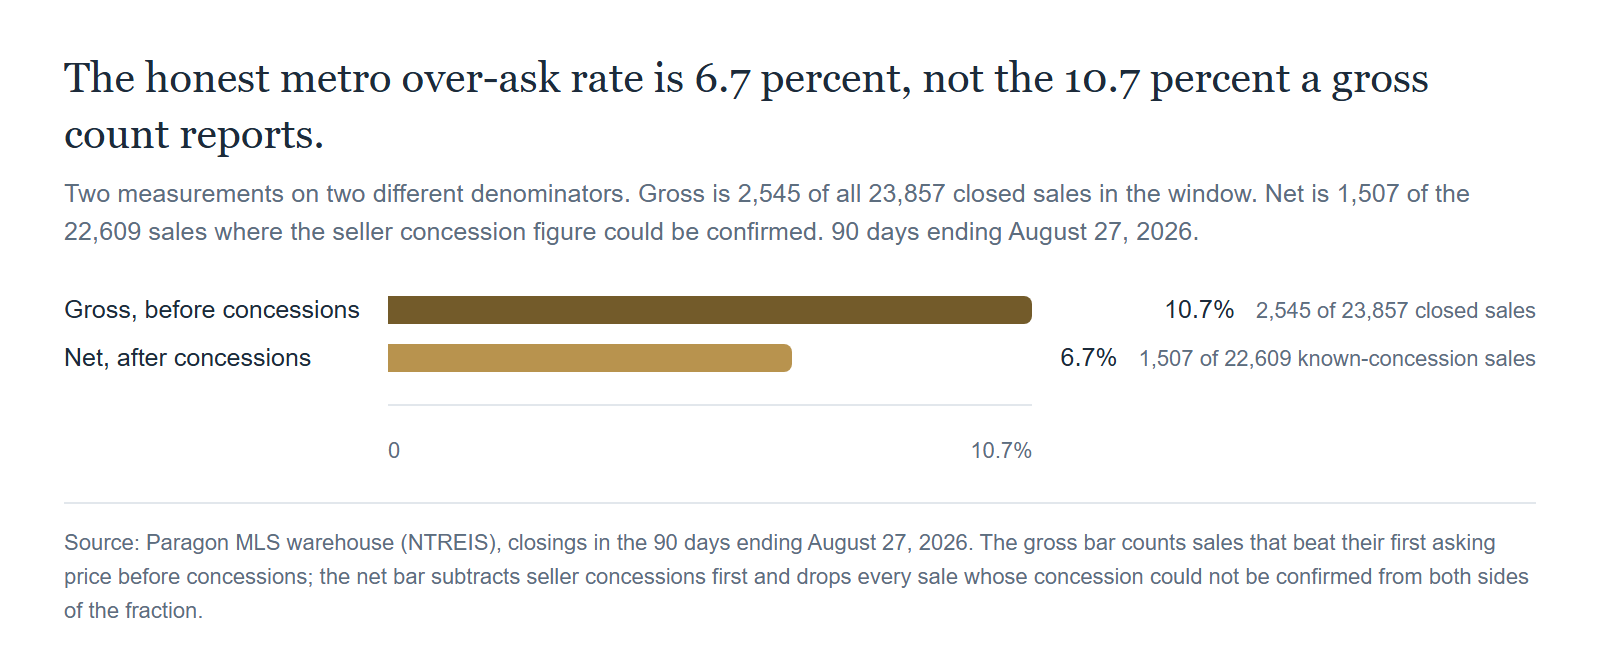
6.7 percent. That is 1,507 net over-ask sales divided by 22,609, the full set of closed sales in the window where we could confirm the concession figure one way or the other. State the complement out loud, because it is the more useful number for anyone being told "everyone is selling over asking" as a negotiating tactic: 93.3 percent of that same set did not clear both hurdles once concessions were subtracted.
The gross reading of 10.7 percent is not wrong. It answers a different question on a different base, and the base is the part that gets dropped when a number travels. Putting the two side by side without naming both denominators does the same thing the cookout brag does.
One honesty note belongs here. This is every sale reported to NTREIS as of the August 27, 2026 run, not every sale that will eventually close in this window. When we re-ran the same methodology against a fixed 90-day window ending August 19, 2026, six days later, the count of closed sales inside that same fixed window grew by 1,067, purely from late-arriving closings. The most recent weeks of any 90-day window are the least complete part of it, which is why this report gets re-run before publication rather than treated as permanent.
Where the Wins Are Real, and Where They Aren't
478 subdivisions in the window cleared the 6-sale floor. Only 25 also cleared the 3-net-win floor required to be ranked. That drop, from 478 to 25, is most of this story by itself.
Our own market map shows the same shape from the air, on a looser definition, and the difference between the two is worth a sentence.
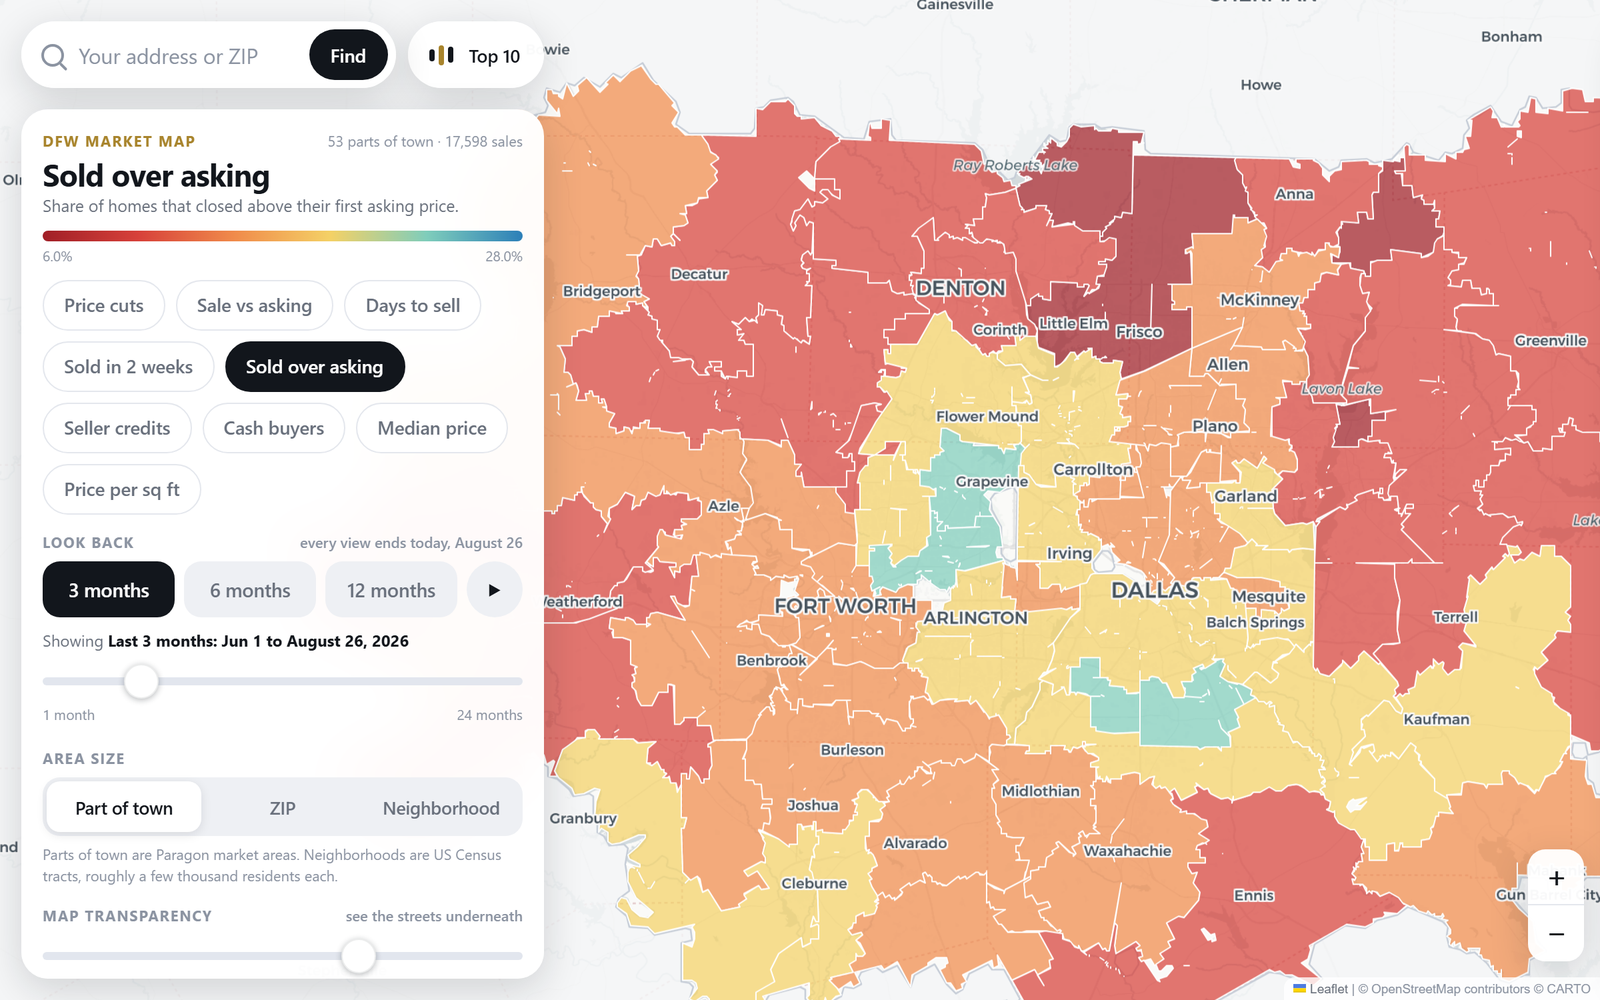
Sold over asking on the Paragon market map: the share of homes that closed above their first asking price. That is a gross measure, taken before seller concessions are subtracted, so it runs higher than the net-of-concessions definition used everywhere else in this article. Source: Paragon DFW market map, homes.paragondfw.com/market-map.
The map's layer answers rule one only. This article's 6.7 percent applies rules one, two, and three. Read the map for where the heat is, then read the table below for what survived the closing table. The live version is at the live map, where you can zoom to your own block.
No Frisco subdivision cleared both floors. That is precise phrasing on purpose: it does not mean no home in Frisco sold over asking, only that no Frisco subdivision reached the 3-net-win threshold. Four Frisco subdivisions had at least one net win, East Village Ph 1 at 2 of 7 being the best of them, and none reached three. Collin County's only qualifier is McKinney's Trinity Falls, at 8.3 percent on 48 known-concession sales, one of the lowest net rates on the entire table. Worth saying directly, because a national ranking just crowned both of these suburbs: Frisco and McKinney, the two cities WalletHub ranked number one and number two in America, together produced exactly one qualifying over-ask subdivision between them, while Fort Worth alone produced nine.
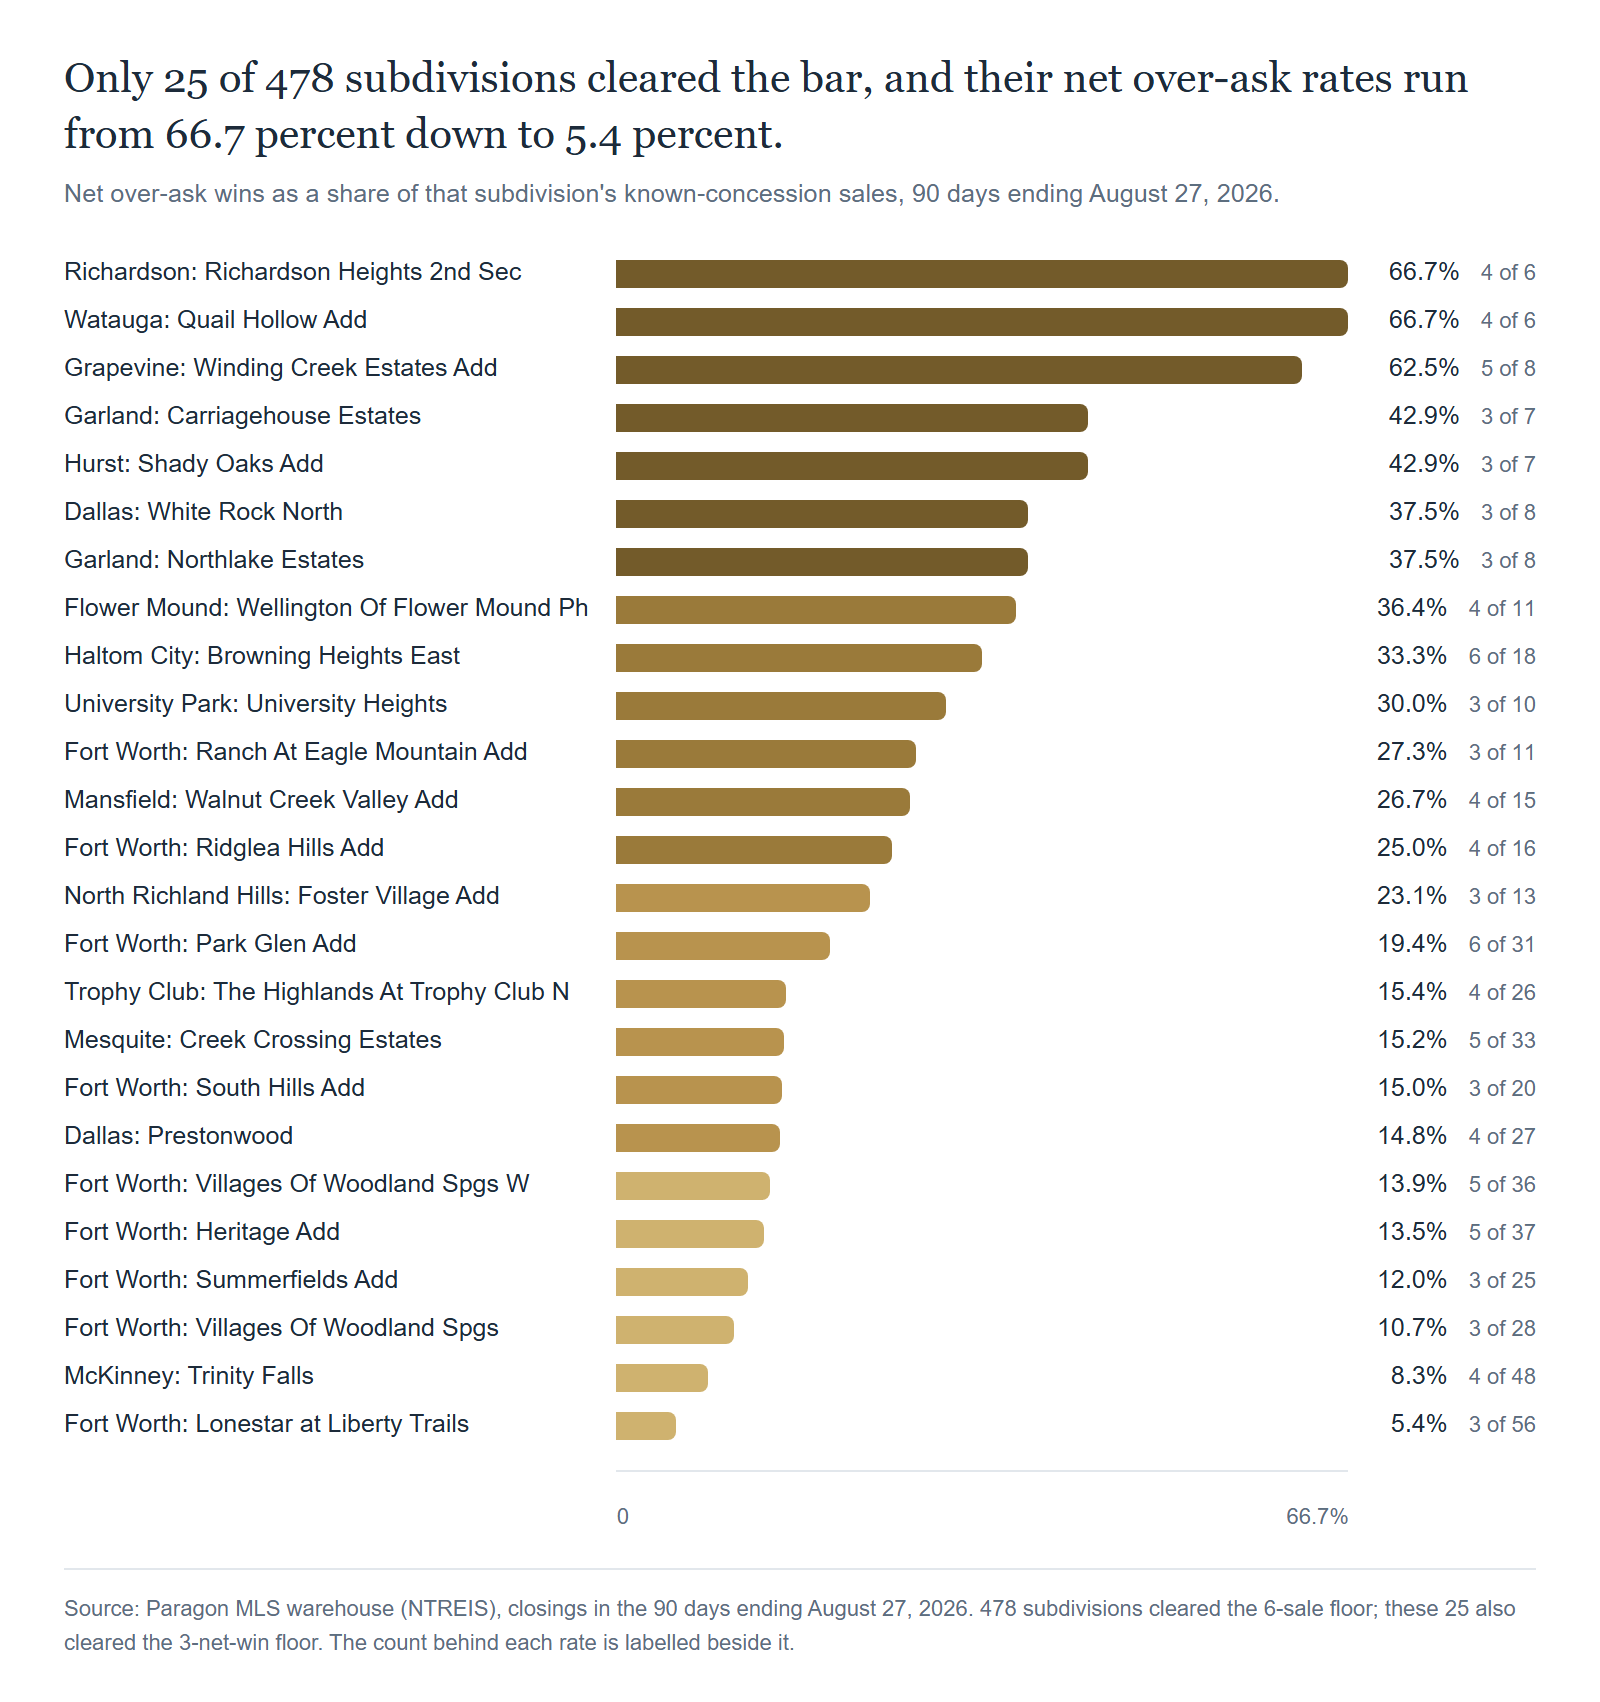
Sample size is not the same for every row. The top of the chart, 4 wins out of 6 sales in Richardson Heights 2nd Sec and in Watauga's Quail Hollow, is a real, small sample rather than a statistic: genuine outcomes, but one more closing next month could move the percentage several points either way. The sturdier claims sit in the volume rows, where 25 or more sales stand behind the rate, and there the net percentages run noticeably lower.
The rows also sit in three price bands that should not be read against each other. Eighteen of the 25 fall between roughly $220,000 and $600,000 in average close price, the volume tier. Six sit between about $715,000 and just over $1,000,000. University Heights in University Park stands alone above both, at a $5,130,260 average close on 10 sales, a real ultra-high-end pocket that does not belong on the same chart as the other two tiers.
Full list, for reference:
City | Subdivision | County | Known-Conc. Sales | Net Wins | Net % | Median Net Premium | Avg. Close |
|---|---|---|---|---|---|---|---|
Richardson | Richardson Heights 2nd Sec | Dallas | 6 | 4 | 66.7% | 8.1% | $821,002 |
Watauga | Quail Hollow Add | Tarrant | 6 | 4 | 66.7% | 1.7% | $333,833 |
Grapevine | Winding Creek Estates Add | Tarrant | 8 | 5 | 62.5% | 0.8% | $728,822 |
Garland | Carriagehouse Estates | Dallas | 7 | 3 | 42.9% | 3.7% | $288,829 |
Hurst | Shady Oaks Add | Tarrant | 7 | 3 | 42.9% | 4.1% | $376,000 |
Dallas | White Rock North | Dallas | 8 | 3 | 37.5% | 1.0% | $1,037,500 |
Garland | Northlake Estates | Dallas | 8 | 3 | 37.5% | 4.2% | $223,762 |
Flower Mound | Wellington Of Flower Mound Ph | Denton | 11 | 4 | 36.4% | 2.7% | $715,195 |
Haltom City | Browning Heights East | Tarrant | 18 | 6 | 33.3% | 4.8% | $242,938 |
University Park | University Heights | Dallas | 10 | 3 | 30.0% | 3.2% | $5,130,260 |
Fort Worth | Ranch At Eagle Mountain Add | Tarrant | 11 | 3 | 27.3% | 1.3% | $414,400 |
Mansfield | Walnut Creek Valley Add | Tarrant | 15 | 4 | 26.7% | 2.9% | $372,205 |
Fort Worth | Ridglea Hills Add | Tarrant | 16 | 4 | 25.0% | 1.0% | $547,906 |
North Richland Hills | Foster Village Add | Tarrant | 13 | 3 | 23.1% | 0.6% | $364,827 |
Fort Worth | Park Glen Add | Tarrant | 31 | 6 | 19.4% | 1.4% | $383,888 |
Trophy Club | The Highlands At Trophy Club N | Denton | 26 | 4 | 15.4% | 2.6% | $932,758 |
Mesquite | Creek Crossing Estates | Dallas | 33 | 5 | 15.2% | 1.5% | $285,536 |
Fort Worth | South Hills Add | Tarrant | 20 | 3 | 15.0% | 5.0% | $293,520 |
Dallas | Prestonwood | Dallas | 27 | 4 | 14.8% | 2.7% | $789,099 |
Fort Worth | Villages Of Woodland Spgs W | Tarrant | 36 | 5 | 13.9% | 0.6% | $382,851 |
Fort Worth | Heritage Add | Tarrant | 37 | 5 | 13.5% | 1.4% | $509,077 |
Fort Worth | Summerfields Add | Tarrant | 25 | 3 | 12.0% | 0.9% | $299,392 |
Fort Worth | Villages Of Woodland Spgs | Tarrant | 28 | 3 | 10.7% | 0.1% | $476,884 |
McKinney | Trinity Falls | Collin | 48 | 4 | 8.3% | 0.5% | $597,269 |
Fort Worth | Lonestar at Liberty Trails | Denton | 56 | 3 | 5.4% | 2.3% | $333,341 |
Based on information from the North Texas Real Estate Information Systems, Inc. Data deemed reliable, but is not guaranteed accurate by the MLS or NTREIS.
The 610 That Still Won
610 sales in this window carried a seller concession and still cleared both hurdles: the net price beat the final list price, and it beat the first asking price too. That matters for any seller weighing a rate buydown or a repair credit to get a deal done. A concession does not automatically erase a real win, and writing a check at the table does not mean giving the whole negotiation back.
One correction belongs here. Paragon's own August 19, 2026 method document, cited below, published 811 as the count of concession sales that still netted over ask, computed against the final list price only, with no chain-first gate. Applying the chain-first test to that identical window drops the strict figure to 672. For the current window it is 610, a definitional tightening rather than a walked-back claim.
How This Compares to the Last Real Frenzy
DFW has seen a real bidding-war market before, and it is worth knowing how far today's numbers sit from it.
Redfin reported that in the four weeks ending March 21, 2021, 39 percent of homes nationally sold above their final list price, up from 24 percent a year earlier. By May 2021, that national share reached a reported 54 percent, up from 26 percent a year prior, with the average sale-to-list ratio hitting 102.2 percent. Locally, Redfin data reported by CultureMap Dallas put the Dallas metro's share of sales above final list price at 38.2 percent in April 2021.
Every one of those figures is measured against the final list price, gross of any concession, with no chain-first-original test applied. That is a looser bar than either of our numbers: our 10.7 percent gross figure is measured against the first asking price in the relist chain, and our 6.7 percent net figure subtracts concessions on top of that. Read them as an upper bound on a looser measurement, not as directly comparable to ours.
Even Redfin's own year-earlier baseline, the 24 to 26 percent it cited for the period before those peaks, sits well above our current 10.7 percent gross reading. The comparison is directional only. Even read that loosely, today's DFW market is nowhere close to the conditions of that frenzy.
The Paragon Angle
In our experience, the sale price that gets reported is the gross number, before concessions, so a sale that only cleared asking before concessions still lands in the comparable-sales record at a price the seller did not actually keep. Someone eats that difference, and it is not the seller who wrote the check. It is the neighbor down the street who never sold anything: where a gross number becomes the comp of record, a homeowner who did not transact ends up valued off a premium nobody kept. That is the same appraisal question this issue's lead piece walks through on the tax side, arriving through a different door.
If you are selling in one of the volume subdivisions above, do not let a metro-wide headline talk you into discounting your list price. Ask for this math on your specific block before you decide what number to lead with. If you are a buyer being told a home "sold over asking" as a reason to bid more, ask for the net number and what share of the neighborhood it represents.
The honest read is not that "sold over asking" is a myth everywhere. It is real, and it is concentrated in a specific, mostly Tarrant County list of subdivisions and price tiers. Outside that list, treating the phrase as a default assumption is how a seller ends up disappointed at their own listing appointment, and how a buyer ends up overpaying based on a story rather than a settlement statement.
Frequently Asked Questions
What does "sold over asking" actually mean in Texas real estate?
It depends entirely on who is saying it and what they measured against, which is why the phrase gets misused. This piece defines it as beating the original asking price of the first listing in a home's relist chain, not the price after cuts, and still beating both that price and the final list price after subtracting seller concessions paid at closing.
Do seller concessions count against a home selling over asking?
They are subtracted first. A close price above the asking price is not a real win if the rate buydown, repair credit, or other concession the seller wrote at closing wipes out the premium, though plenty of sales carry a concession and still net over: 610 did in this window. A sale with no verifiable concession figure is excluded entirely, in both directions.
Which DFW counties and neighborhoods are genuinely selling over asking right now?
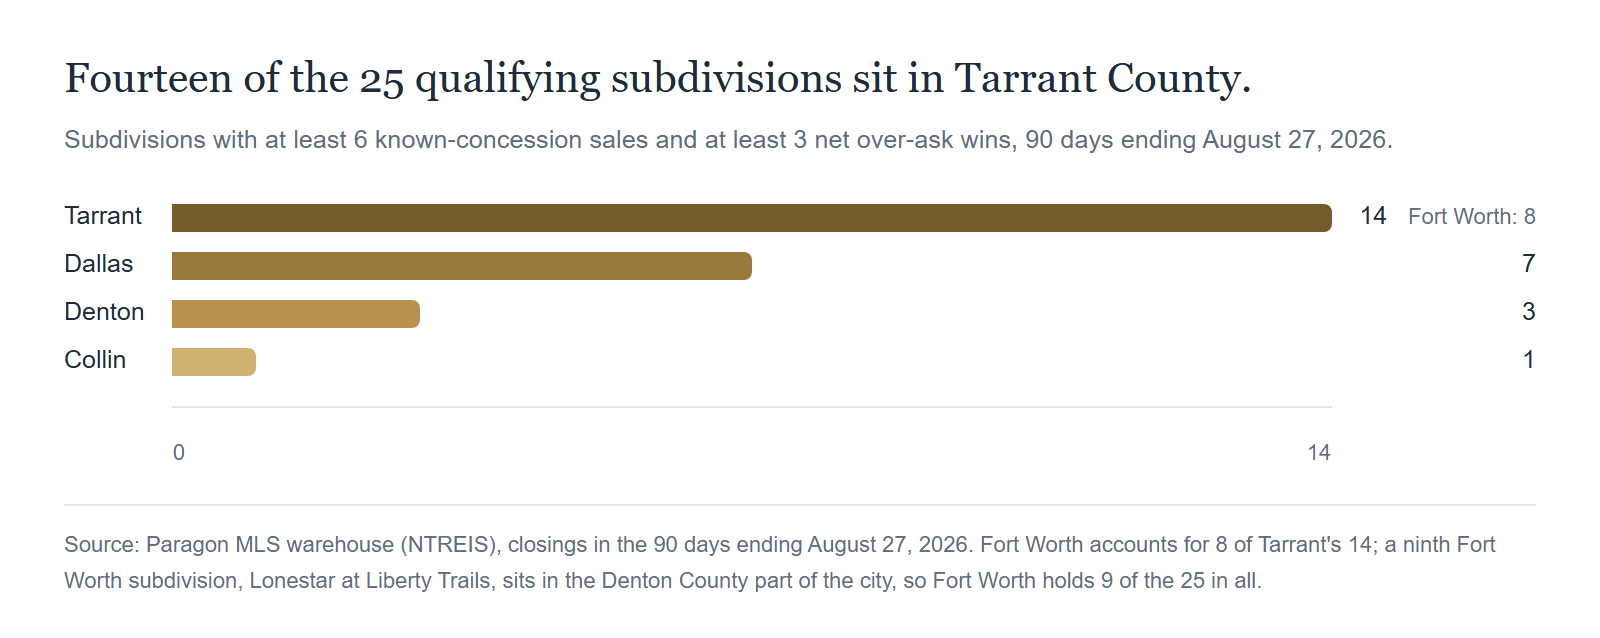
The 25 subdivisions that met both floors concentrate heavily in Tarrant County, which holds 14 of them. Dallas County has 7, Denton has 3, and Collin has just 1, McKinney's Trinity Falls, at 8.3 percent.
Is "over asking" measured against the original list price or the price after cuts?
Always the original, chain-first list price, looking back up to 365 days before close. A home that cut its price and closed above that lower, cut price is not counted as selling over asking here, because it never beat what the seller originally asked for.
How often do DFW homes really sell over asking?
6.7 percent of the 22,609 closed sales with a known concession figure beat both their first asking price and the final list price after concessions were subtracted. A looser, gross measurement against a larger base of 23,857 total sales puts the figure at 10.7 percent. Neither is the 40-plus percent a casual read might suggest.
Conclusion: A Stat Is Only as Good as Its Denominator
"Sold over asking" is a real, verifiable outcome in DFW right now, for a concentrated list of subdivisions, most of them in Tarrant County, at ordinary resale price points. Outside that list the phrase does more work than the data supports: 25 subdivisions out of the 478 that cleared the sample floor, on a metro-wide net rate of 6.7 percent. Nearly four in ten sales that looked like a win before concessions gave that premium back at the closing table and landed at the asking price or below it.
The next time someone tells you a neighborhood is selling over asking, the useful question is not whether it is true. It is: over what asking price, net of what, and out of how many sales. Ask for the number and the denominator together, or ask us, and we will run it for your specific street.
Ready to Talk Numbers, Not Headlines?
Want the honest over-ask number for your own street, your own subdivision, or a specific home you are watching? Let's connect and walk through the actual math.
Email: [email protected]
Phone: (469) 290-7593
paragondfw.com/contact
Related Articles
- The Appraisal Escalator: Dallas Is About to Cut Your Tax Rate for an 11th Year
- Frisco Is Ranked the Number 1 Housing Market in America. Our Sold Data Tells a Different Story.
- Grapevine: The Small Town DFW Grew Around and Never Flattened
- We Mapped 301,062 DFW Home Sales. Go Find Your Neighborhood.
- Why Your DFW Home Isn't Selling: The 7 Mistakes That Kill Listings
Sources
- Local market figures: Paragon MLS warehouse (NTREIS), `over_ask_report.py` run 2026-08-27.
- Generator and methodology: `scripts/over_ask_report.py --end-date 2026-08-27 --days 90`, executed 2026-08-27, covering closed sales reported to NTREIS in the 90 days ending August 27, 2026.
- NTREIS notice: "Based on information from the North Texas Real Estate Information Systems, Inc."
- NTREIS notice: "Data deemed reliable, but is not guaranteed accurate by the MLS or NTREIS."
- Paragon Realty Advisors, `paragon/over-ask-campaign-method-2026-08-19.md`, the original three-rule method document (August 19, 2026).
- Paragon DFW market map, "Sold over asking" layer: https://homes.paragondfw.com/market-map
- Paragon Realty Advisors, "We Mapped 301,062 DFW Home Sales. Go Find Your Neighborhood." (August 11, 2026): https://www.paragondfw.com/blog/we-mapped-every-dfw-home-sale-go-find-your-neighborhood
- Paragon Realty Advisors, "Why Your DFW Home Isn't Selling: The 7 Mistakes That Kill Listings": https://www.paragondfw.com/blog/why-your-dfw-home-isnt-selling-the-7-mistakes-that-kill-listings
- Redfin, "Redfin Reports a Record 39% of Homes Sold Above List Price," PRNewswire, March 2021: https://www.prnewswire.com/news-releases/redfin-reports-a-record-39-of-homes-sold-above-list-price-301256577.html
- Redfin, "Over Half of Homes Sold Above List Price in May for the First Time On Record," PRNewswire, June 2021: https://www.prnewswire.com/news-releases/over-half-of-homes-sold-above-list-price-in-may-for-the-first-time-on-record-301314534.html
- CultureMap Dallas, "New real estate report reveals whopping increase in Dallas home prices" (reporting on April 2021 Redfin data): https://dallas.culturemap.com/news/real-estate/05-24-21-new-report-housing-price-increase-redfin/
- Paragon Realty Advisors' operational definition of "seller contribution" and net over-ask, as codified in `scripts/over_ask_report.py` and documented on the internal over-ask data card (refreshed August 27, 2026).